We have seen that when a quantity increases or decreases by the same amount for each additional unit of the input variable, the value of the output variable can be modeled as a linear model. That is, linear models have a constant average rate of change. For example, think of getting a $500 raise every year; in this case, the average rate of change is $500/year.
When a quantity increases or decreases by the same percentage for each additional unit of the input variable, the value of the output variable can be modeled as an exponential model. Exponential models have a constant percent change and a constant change factor. For example, think of getting a 3% raise every year; in this case, the constant change factor is 1.03.
Carefully explain in words how you know that your table has an exponential model. Your explanation should use percent changes and/or change factors, not a formula.
Carefully explain in words how you know that your table doesn’t have an exponential model. Your explanation should use percent changes and/or change factors, not a formula.
We looked at the populations of three small towns in Section 7.1. All three towns had a population of 5500 in 2010, but their populations were changing in different ways:
Determine which town’s population has a linear model. Explain how you know, and find a formula for the population \(P(t)\) of this town \(t\) years after 2010.
The populations of the other two towns have an exponential model. Explain how we know this from the verbal description of the change in the towns’ populations and find the change factors.
In Section 7.1, you found the populations of all three towns in 2011, 2012, 2013, and 2020. Plot the populations of all three towns on the graph below. What do you notice?
The town in Indiana’s population is increasing by 2.5% each year, so the change factor is 1.025. The table below shows computations for finding the population in 2011, 2012, and 2013.
Your answer to the previous question is the formula for an exponential model for the Indiana town’s population! Find a formula for an exponential model for the Ohio town’s population.
Suppose that the cost of attending a certain four-year private college (tuition and fees) was $16,500 in 1977 and that the cost increased about 3.2% every year.
Explain one strategy you could use to determine the year when this model would predict a cost of $42,000. Assume we are using the original cost of $16,500 for 1977.
The rate of elimination of caffeine from the human body varies greatly from individual to individual. Suppose that Jacob drinks a 16-ounce coffee drink that contains about 310 mg of caffeine. His body eliminates about 13% of the caffeine every hour. Hint: Assume all caffeine is absorbed into the body as soon as the coffee is drunk.
Create a formula for an exponential model for this situation. Let \(t\) be the number of hours after drinking a 16-oz cup of coffee, and let \(A\) be the amount of caffeine in your body.
Use a graphing utility to create a precise graphical model of the amount of caffeine in Jacob’s body from one 16-ounce coffee drink. Use your graph to answer the question. Include a sketch of your graph and the steps you used to find the answer here.
If Jacob drank a 12-ounce Pepsi containing 38 mg of caffeine instead of the coffee drink, how long will it take for Jacob’s body to eliminate half of the caffeine? Write your answer rounded to the nearest whole hour.
Shawn’s brand new Dodge Charger valued at $52,445 depreciates at the rate of 8% per year. He plans to sell it in 5 years. How much will it be worth then?
Fletcher currently exercises for about an hour per week. They’d like to exercise for the recommended 150 minutes per week. They know that they’re more likely to sustain the change if they slowly increase the amount they’re exercising each week instead of trying to jump from one hour to 150 minutes. If Fletcher increases how much they exercise by 20 minutes each week, how many weeks will it take them to get to their goal of 150 minutes per week?
Joan quit her job at GM when she was 35 years old. Her friend, who is a financial advisor, recommended that she leave her 401(k) retirement savings in GM’s retirement plan rather than withdrawing or transferring the money to a new plan. Her friend said that, on average, Joan could expect a 6% increase per year if she left her money in the plan for many years, based on the past performance of GM’s plan. Joan will not be able to add more money to the GM 401(k) account, but can open a new one at her new job. How long will it take for the amount of money Joan has in the GM 401(k) to double?
The half-life of a substance with an exponential model is the amount of time it takes for half of the substance to be eliminated. For example, the half-life of a drug in the blood in the amount of time it takes for half of the drug to be elminiated from the body, and the half-life of a radioactive element is the amount of time it takes for half of the starting amount to decay.
If the half-life of a certain drug is 3 hours, and 25 mg of the drug is in the blood at 5 pm, how much of the drug will be in the blood at 8 pm? How long will it take for there to be 6.25 mg of the drug left in the blood?
Earlier, we assumed that the body could eliminate 13% of the caffeine present every hour. Wikipedia states that the half-life of caffeine in a healthy adult is often between 4.9 and 6 hours. 2
The antibiotic tetracycline is used for treatment against many different bacterial infections. Suppose that an individual is given 300 mg of tetracycline per dose, and the half-life of tetracycline is 8 hours. Assume all tetracycline is absorbed into the body immediately.
It would be more convenient to have a formula for \(A\text{,}\) the amount of tetracycline in the body, after \(t\) hours! If it has been \(t\) hours, how many 8-hour periods has it been? Use your observation to rewrite your formula for \(A\) in terms of \(t\) instead of \(x\text{.}\)
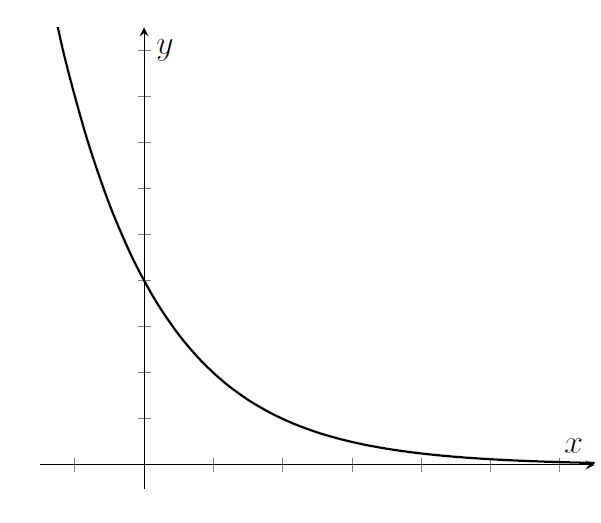
Decreasing exponential model on axes with no labels, but several tick marks. The vertical intercept is at the fourth tick mark above 0. The graph goes through the point at the first horizontal tick mark and the second vertical tick mark. By the sixth horizontal tick mark, the graph is just barely above the horizontal axis.
Write a formula for an exponential model that cannot possibly fit this curve. Explain in words how you know your model cannot work, no matter what numbers are on the axes.
Challenge: Find a second exponential model that could fit this curve! Explain in words how you know this model is different from your first model, and why this new model is also a valid option.
List at least two other situations where quantities, other than those seen here, might have a constant percent change and be represented with an exponential model. Explain your reasoning.