
Section 1.2 Mathematical Models Activities

Media outlets regularly publish rankings of cell phone carriers, travel destinations, colleges, TVs, and credit cards, just to mention a few.
Here’s an example of one such ranking - the β€œBest Places to Retire on Earth
 1 
www.investopedia.com/articles/retirement/062016/6-countries-where-you-can-live-social-security.asp
,” according to investopedia.com
 2 
investopedia.com
. To determine which countries are the best for retirees, they used a scoring system that measured seven categories:
The top 4 countries with the highest cumulative average score across all those categories are Costa Rica, Portugal, Mexico, and Panama.
When creating rankings like the one above, we first need to decide what factors (variables) will contribute to the overall ranking. Then, we need to decide how those factors can be measured (quantified). Finally, we need a formula that combines all of them into one overall score.
Important factors for a decision or situation are called variables. Variables that have values that are numbers called quantitative variables.

Activity 1.2.1.

In your group, agree on a topic that interests everyone (or most of you!), and try to come up with a strategy to create a ranking system related to that topic. After agreeing on a topic, think about:
  • What variables to use;
  • How to measure those variables; and
  • How to combine all of them into one overall score.

Activity 1.2.2.

Every year, U.S. News & World Report publishes a list of the best colleges in the United States. Colleges on the list are ranked based on many different factors, such as first-year student retention, graduation rates, and faculty strength.

(a)

Using what you know about how U.S. News ranks colleges, discuss what things you might include in your decision in choosing a college. That is, what factors would be important to your decision?

(b)

Brainstorm how numeric values could be used to quantify (express with numbers) the variables you identified above. Include the units of measurement.
A mathematical model is a description of a system, or situation, using mathematical concepts, language, and numbers. People often use variables to help create mathematical models. Mathematical models can be represented as equations, tables, graphs, or descriptions in words.

Activity 1.2.3.

Let’s look at a mathematical model for ranking community colleges that combines variables to give us one number for each community college. The Aspen Institute awards the Aspen Prize every other year. The award β€œhonors those institutions that strive for and achieve exceptional levels of success for all students, while they are in college and after they graduate.”
 3 
In addition to the prestige of winning this award, the winning college also receives a $1 million cash prize. To determine the 150 finalists for the award, the Aspen Institute collects information from 1000 community colleges related to the following variables:
  1. Performance - The performance score measures student success in persistence, degrees awarded, completion, and transfer;
  2. Change - The change score measures consistent improvement in these areas over time; and
  3. Minority Achievement and Family Income - The minority achievement score and family income score measure equitable outcomes for students of all racial/ethnic and socioeconomic backgrounds.
Each of these scores is created from combining a great deal of information about many factors.

(a)

Look at the scores in the table below for four community colleges. Which school do you think is the β€œbest?” Why? (Hint: What data are you focusing on in the table?)
Table 1.2.1.
College State Performance Change Minority Achievement Family Income \(R\)
Bergen Community College NJ 299 800 178 70
Miami Dade College FL 323 400 288 191
Northwest Iowa Community College IA 503 200 437 99
Pearl River Community College MS 444 600 275 118

(b)

The Aspen institute used the following mathematical model equation to calculate a score for each school:
\begin{equation*} R = 0.33P + 0.33C + 0.27M + 0.07F \end{equation*}
where:
Use this equation to calculate the overall score for each of the schools and enter it into the table above. According to the overall score you calculated, which school is best?

Activity 1.2.4.

Body Mass Index, or BMI, is often used to classify people as obese or underweight. The formula for BMI is
\begin{equation*} BMI = \frac{\text{weight (in kilograms)}}{[\text{height (in meters)}]^2} \end{equation*}

(b)

A 2012 study
 4 
found that the proportion of Americans that are severely obese was increasing. How do you think the researchers in this study obtained information about these variables? Imagine yourselves as the researchers. You will want a large, varied sample, and you have limited funds. What would be a good way to get people’s height and weight from diverse U.S. locations?

(c)

If you want to determine whether someone is obese, are there any other variables that might be important to consider?

(d)

The table below lists known heights and weights of several current and former athletes. Calculate the BMI for each of the athletes. Use the fact that one inch is 0.0254 meters and one pound is about 0.454 kilograms.
Table 1.2.2.
Athlete Height (ft & in) Height (m) Weight (lbs) Weight (kg) BMI (\(\textbf{kg/m}^\mathbf{2}\))
Rory McIlroy (Golf) 5 ft 10 in 160
Julianna Penn (UFC) 5 ft 7 in 135
Cam Gallagher (Baseball) 6 ft 3 in 230
Breanna Stewart (WNBA) 6 ft 4 in 170
Shaquille O’Neal (NBA) 7 ft 1 in 325
Maria Sharapova (Tennis) 6 ft 2 in 130

(e)

The Centers for Disease Control and Prevention (CDC) suggests that
  • BMI below 18.5 is underweight
  • BMI between 18.5 and 24.9 is normal
  • BMI between 25 and 29.9 is overweight
  • BMI of 30 and above is obsese
What are the athletes’ classifications based on their BMIs? What does this suggest about limitations of the BMI model?

(f)

Consider the following two scenarios. In each scenario, which person has the lower BMI?
  • Marisol and Adelyn have the same weight, but Marisol is taller.
  • Aries and Niko have the same height, but Aries weighs more.

Activity 1.2.5.

Most of the mathematical models that we’ll explore in this class are functions. A function is a special type of mathematical model that matches each value of its input quantity to exactly one value of its output quantity. Mathematicians use a special notation for functions, \(f(x)\text{,}\) which is read β€œ\(f\) of \(x\)”. It has three parts:
  • \(f\) is the name of the function or model
  • \(x\) is the input
  • \(f(x)\) all together is the output. If we have \(f(x) = y\text{,}\) then \(y\) is also the output.
Identify the input, output, and function name in each of the math sentences below.

Activity 1.2.6.

Function notation is a compact way to keep track of and connect several pieces of information. Let’s practice interpreting it in an example.
The table below shows the percent of US adults (18+) who said they used Instagram in each year
 5 
Data from Pew Research Center surveys on social media use.
.
Table 1.2.3. Percent of US Adults That Use Instagram
Year, \(y\) 2012 2013 2014 2015 2016 2018 2019 2021 2023
Percent, \(P(y)\) 13 17 26 28 32 35 37 40 47
Using function notation, we can write the sentence β€œ13% of US adults used Instagram in 2012” as \(P(2012) = 13%\text{.}\)

(a)

Use function notation to write the sentence β€œ47% of US adults used Instagram in 2023”.

(c)

We can use the table to evaluate expressions in function notation. For example, if we’re asked β€œEvaluate \(P(2018)\)”, the table tells us the answer is \(35\text{.}\)
Evaluate \(P(2021)\text{.}\)

(d)

We can also use the table to solve equations in function notation. For example, if we’re asked β€œSolve the equation \(P(y) = 17\)”, the answer is \(y = 2014\text{,}\) since that’s the year in which \(17%\) of US adults used Instagram, according to the table.
Solve the equation \(P(y) = 28\text{.}\)

Activity 1.2.7.

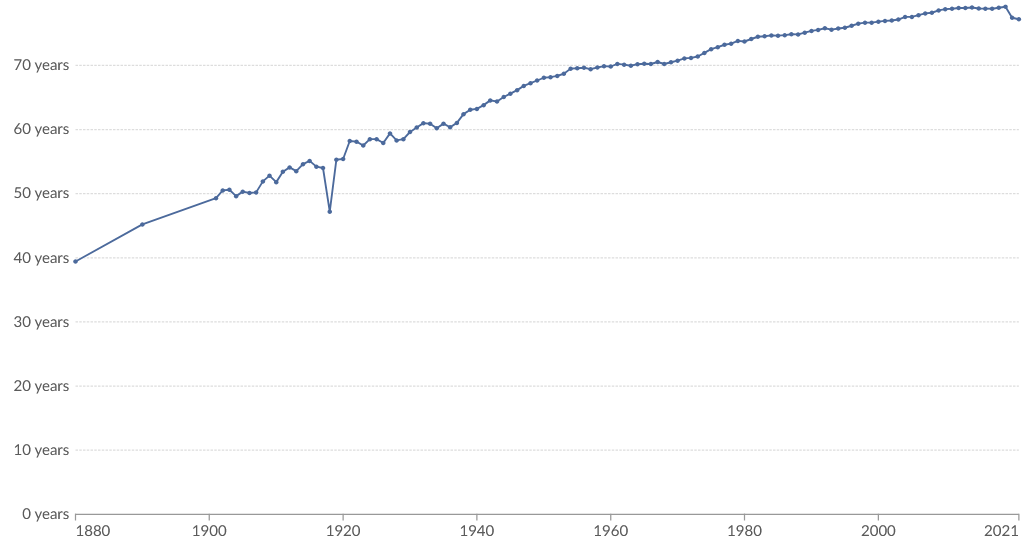
We can also use function notation with graphs. In the graph below, let \(y\) be the year, and \(L(t)\) be the life expetancy at birth in year \(y\text{.}\)
 6 
β€œData Page: Life expectancy at birth”, part of the following publication: Saloni Dattani, Lucas RodΓ©s-Guirao, Hannah Ritchie, Esteban Ortiz-Ospina and Max Roser (2023) - β€œLife Expectancy”. Data adapted from Human Mortality Database, United Nations, Zijdeman et al., James C. Riley. Retrieved from https://ourworldindata.org/grapher/life-expectancy [online resource], November 25, 2024.
Graph showing life expectancy at birth in the US between 1800 and 2021.
Life expectancy has increased steadily, except for dips during World War I and after COVID-19.
Figure 1.2.4. US Life Expectancy at Birth Between 1800 and 2021.

(a)

Use function notation to write the sentence β€œLife expectancy in 1985 was about 75 years”.

(b)

Interpret \(L(2000) = 76.8\) by writing a sentence in words.

(c)

Use the graph to evaluate \(L(1900)\text{.}\) You’ll need to estimate!

(d)

Use the graph to solve the equation \(L(y) = 60\text{.}\) You’ll need to estimate!

Activity 1.2.8.

Function notation is also often used with formulas.
The velocity, in feet per second, of a car that slammed on its brakes can be determined based on the length of the skid marks that its tires left on the ground. Suppose that on a particular surface, this relationship is given by
\begin{equation*} v(d) = \sqrt{32d}\text{,} \end{equation*}
where \(d\) is the length of the skid marks in feet.

(a)

Use function notation to write the sentence β€œIf the length of the skid marks was 200 feet, then the car was traveling 80 ft/sec”.

(b)

Interpret \(v(100) \approx 56.6\) by writing a sentence in words.

(d)

Use the formula to solve the equation \(L(d) = 100\text{.}\)