In Section 3.2, we explored the cost of electricity in and around Denver, CO, during the summer for customers on the Residential Opt-Out Pricing Plan. We knew that the rates for this plan are 1
Now, let’s consider the cost of electricity in and around Denver in the winter. Use the information given in the table above to build a linear model for the bill amount, \(B(k)\text{,}\) of a customer that uses \(k\) kWh in the winter.
The company that provides electricity to people in and around New Orleans, Louisiana is called Entergy. The table below estimates the winter monthly rates charged by Entergy 2
The situation in Activity 5.2.1 is called “piecewise defined” or a “piecewise linear model.” It is piecewise because the cost changes based on the amount of electricity used. Cost per kWh is not constant, so the graph of this situation is not a line. But it is piecewise linear, because cost per kWh is constant on each piece.
We found that when the number of kilowatt hours used, \(k\) is 800 or less, the bill is \(B(k) = 8.07 + 0.06002k\text{.}\) When the number of kilowatt hours used is more than 800,
The { symbol is there to tell you that this is a piecewise formula. The \(k \leq 800\) at the end of the first line tells you to use that part of the formula when \(k\) is 800 or less. The \(k \gt 800\) at the end of the second line tells you to use that part of the formula when \(k\) is bigger than 800.
Use the piecewise formula to find the bill for customers who used 600 kWh, 900 kWh, and 1200 kWh. You should get the same answers as you did in Activity 5.2.1
In order to conserve water, the Detroit area water system has a two-tiered system of charges. Customers are billed quarterly (every three months) for water usage. The cost to customers is $12.04 per thousand gallons for the first 20,000 gallons of water used, and $21.90 for each thousand gallons over 20,000. In addition there is always a flat quarterly fee of $73.00.
Construct a formula for a piecewise linear model that represents the amount of the quarterly water bill (in dollars) for any amount of water used. Use \(g\) for water usage and \(W(g)\) for water bill amount.
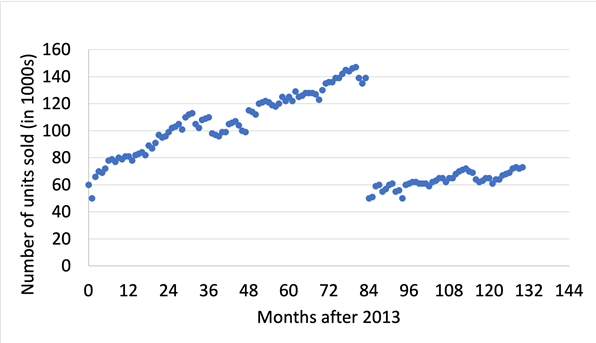
The graph below displays the monthly sales data for a specific clothing item from 2013 - 2023 in the U.S. Let \(t\) be the number of months after January 2013, and \(u(t)\) be the number of units sold (in thousands).
Graph shows that sales tended to increase from Jan 2013 for the next 84 months. In Jan 2013, 60,000 units of the item were sold, and 84 months later, about 140,000 units were sold. But, after 84 months, sales dropped suddenly to about 50,000 units sold. They slowly increased for the next 48 years to about 78,000 units sold.
Figure5.2.6.Difference in average global temperature from the 1850-1900 mean with a trendline. Image from Quantway College Module M.3 by Carnegie Math Pathways
Julio is moving from one apartment to another apartment in a neighboring town. He needs to rent a truck for one day to move his belongings. Julio uses the Internet to search for companies with trucks for rent. He finds two companies that have trucks available on the day he needs one: Rent-A-Truk and Trucks-4-Less.
Rent-A-Truk advertises a rate of $40 for the day, plus 60 cents a mile for every mile over 40 miles.
Fill in the blank with little or no calculation: If Julio only drives _________ miles during the day, Trucks-4-Less will end up being the better deal. Explain your reasoning.
Fill in the blank with little or no calculation: If Julio drives _________ miles during the day, Rent-A-Truk will end up being the better deal. Explain your reasoning.
Julio might want to know at what mileage the cost of the Rent-A-Truk plan equals the cost of the Trucks-4-Less plan. Use your algebraic models to write one equation, using only the variable \(x\text{,}\) that represents this situation. Hint: You can think about this situation as \(R(x) = T(x)\text{.}\) Hint: Julio estimated that this situation occurs at a mileage higher than 40.